››Data Handling — Bar Graph
Grade 2 · Math
Data Handling — Bar Graph
1 activities · Read the Graph!
Read three bar graphs to find the most, least, totals and differences!
SheetBerry · Printable Worksheets
Tips & Praises: ____________________________Tr. Sign.: ____________________Date: _______ Month: _______ Year: _______
1
Read each bar graph. Answer the questions below each one.
Favourite Sports Survey
 football
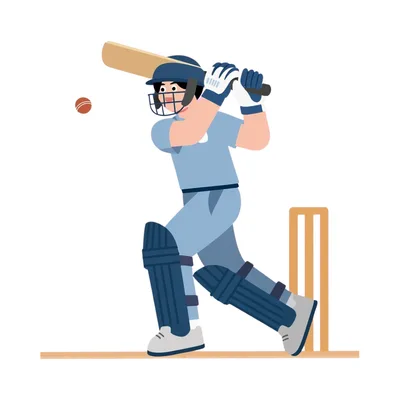 cricket
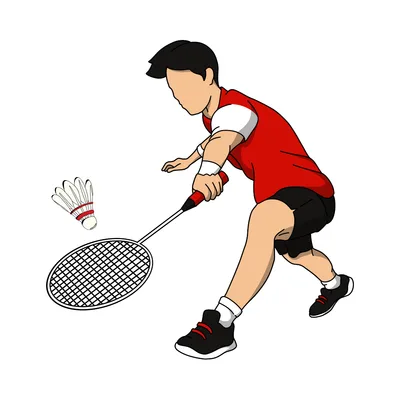 badminton
 kabaddi
1.How many people chose football? 2.Which item is the most popular? 3.Which item is the least popular? 4.How many more chose badminton than football? 5.What is the total number of responses altogether? Fruits in the Basket
1.How many people chose apple? 2.Which item is the most popular? 3.Which item is the least popular? 4.How many more chose grape than apple? 5.What is the total number of responses altogether? Toys in the Toy Box
1.How many people chose ball? 2.Which item is the most popular? 3.Which item is the least popular? 4.How many more chose ball than kite? 5.What is the total number of responses altogether? Colour a star for each activity you finish!
Ask a parent or teacher to check your work!
Teacher's comment
Signed: _______________


 apple
apple banana
 mango
mango grape
grape ball
ball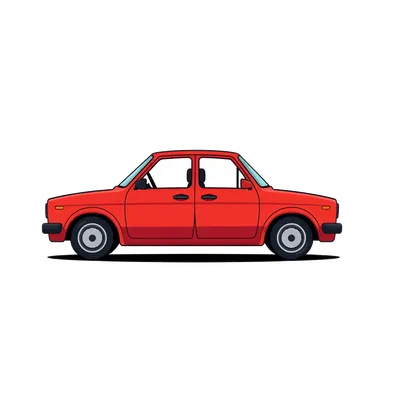 car
car doll
doll