››Reading Pictographs and Bar Graphs
Grade 1 · Math
Reading Pictographs and Bar Graphs
3 activities · Read the Graph!
Read picture-frequency tables and bar graphs — find most, least, totals and differences using fruits, vegetables and vehicles.
SheetBerry · Printable Worksheets
Tips & Praises: ____________________________Tr. Sign.: ____________________Date: _______ Month: _______ Year: _______
1
Read the bar graph. Answer the questions below.
Vegetables in the Basket
1.How many potatoes are there? 2.Which vegetable is there the most? 3.Which vegetable is there the least? 2
Read the pictograph. Answer the questions below.
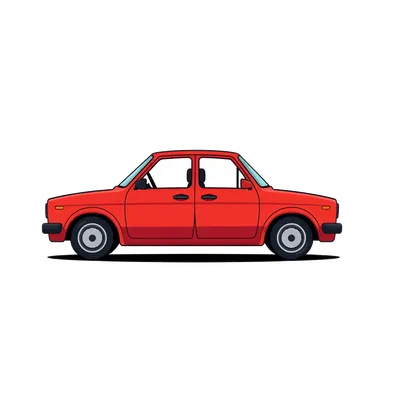
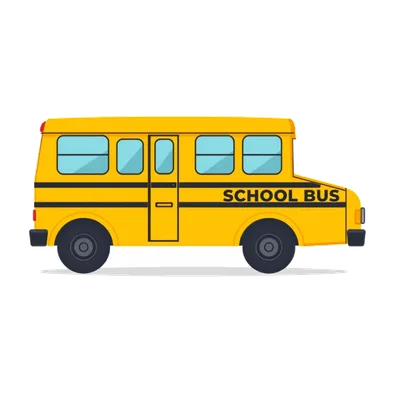
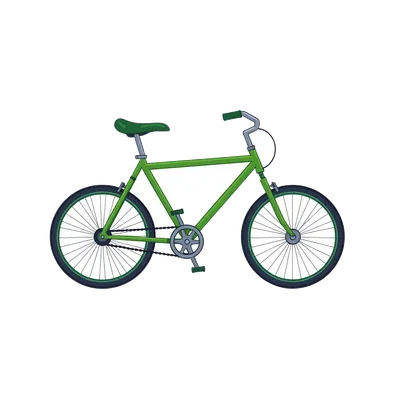
Vehicles on the Road
1.How many cars are there? 2.Which vehicle is there the most? 3.Which vehicle is there the least? 3
Read the pictograph. Answer the questions below.
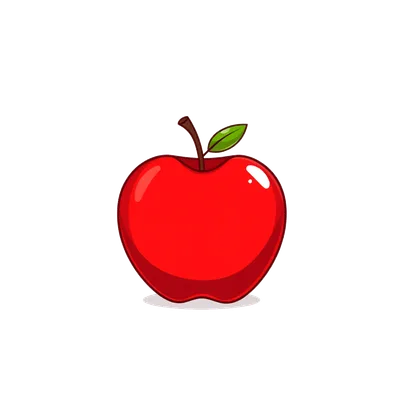
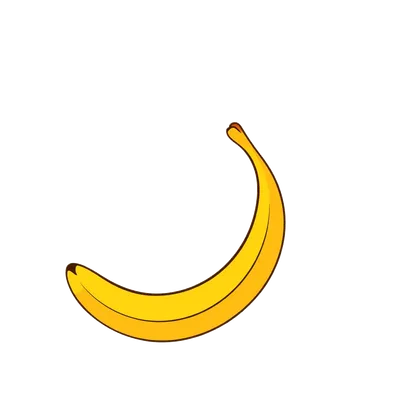
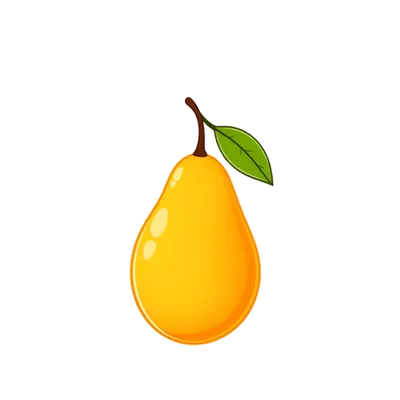
Fruits in the Basket
1.How many bananas are there? 2.Which fruit is there the most? 3.Which fruit is there the least? Colour a star for each activity you finish!
Ask a parent or teacher to check your work!
Teacher's comment
Signed: _______________


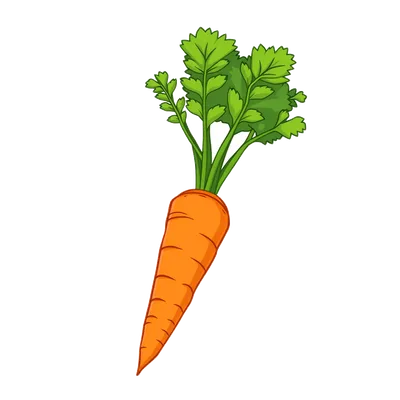 Carrot
 Potato
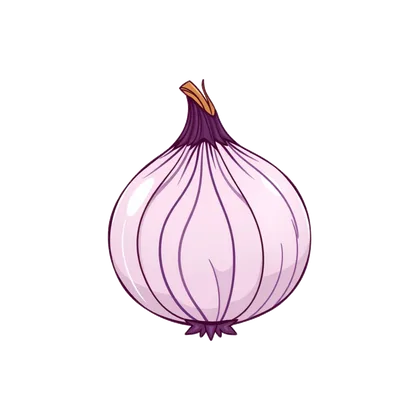 Onion
Onion